Our methodology starts with a hypothesis. To test this hypothesis, we utilize our ground sensor network to collect data. Satellite imagery is used in conjunction with atmospheric and hydrological modeling to round out the analysis. Models and methods will be validated with data from the ground sensors.

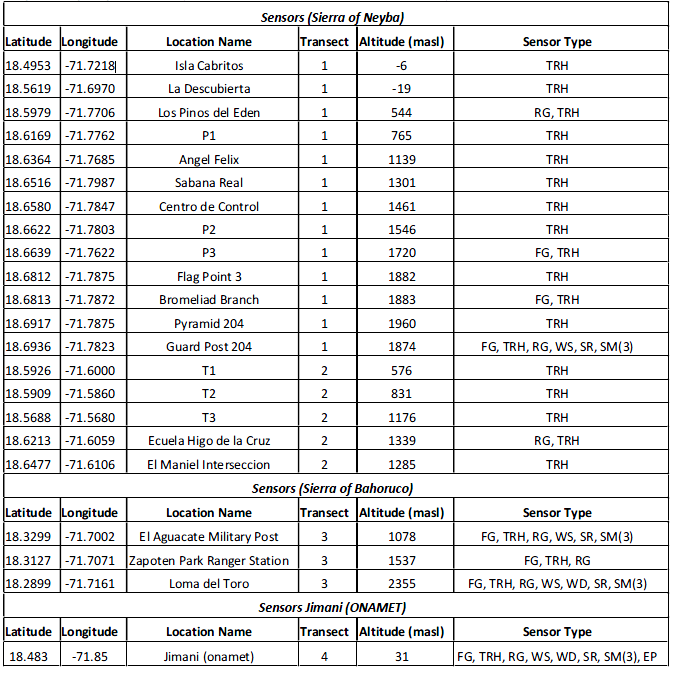
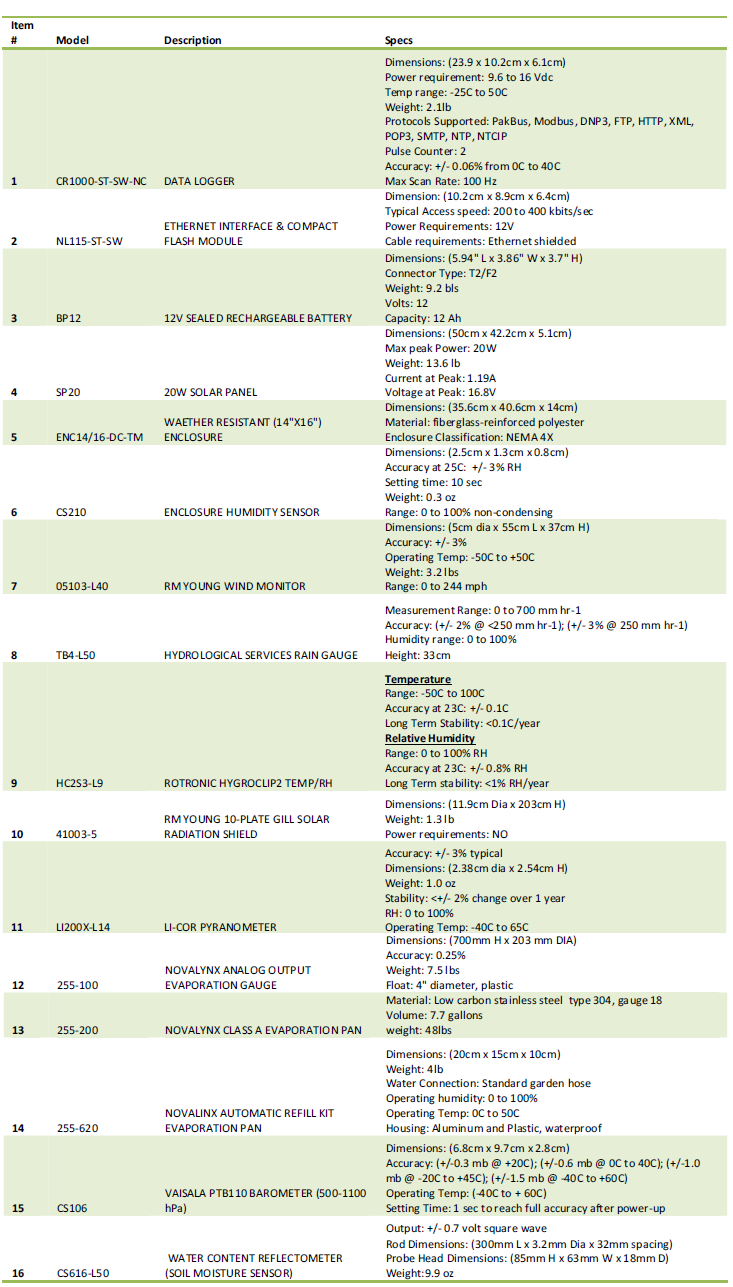
The team of scientists and engineers from City College, INTEC and ONAMET has implemented an array of equipment around the lake to monitor and measure solar radiation, temperature, relative humidity, soil moisture, wind speed and direction, rainfall and fog presence with real time data and remote sensing. The analysis of the data considers changes in the hydroclimatology over the past thirty years by studying factors involving bathymetry, surface area delineation, land use, runoff and climate and hydrological modeling

Ground Sensors Network

The sensors have been set up at various locations around the lake. There are eighteen along the Sierra de Neyba, three along the Sierra de Bahoruco, and the main sensor, the Jimani Station, is located to the southwest of the lake. The Jimani station holds the largest record of historical data for rainfall in the area.


.

Bathymetry

Bathymetry
In order to determine the volume of the lake we performed a bathymetric analysis using an 898c SI HUMMINGBIRD depth sounder, which uses sonar technology to locate and define structure, bottom contour and composition.

3D Animation

Install or enable JAVA

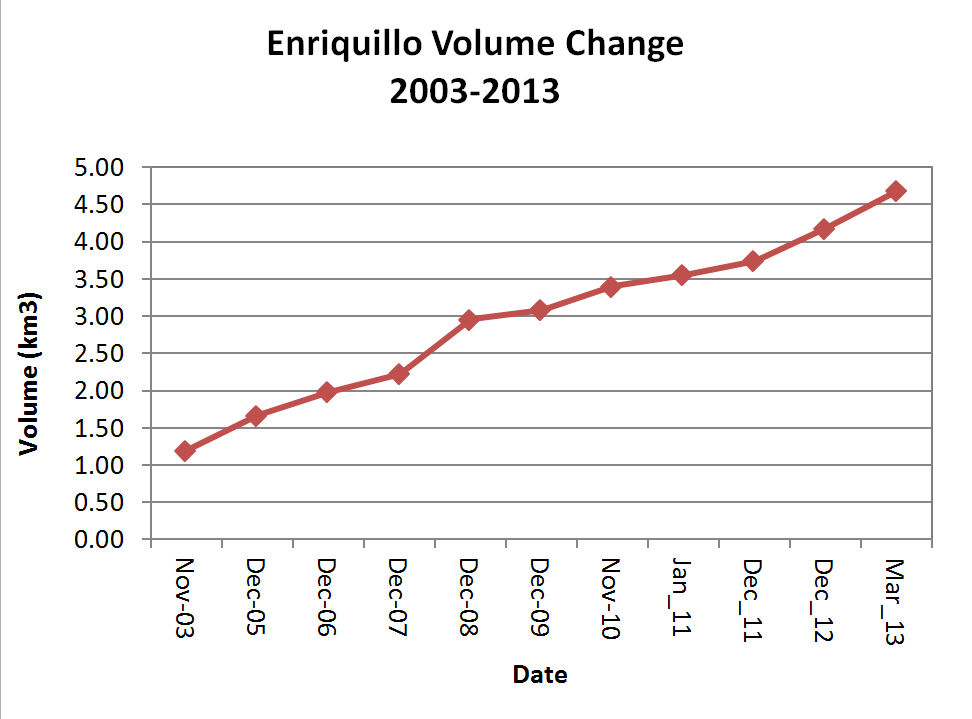
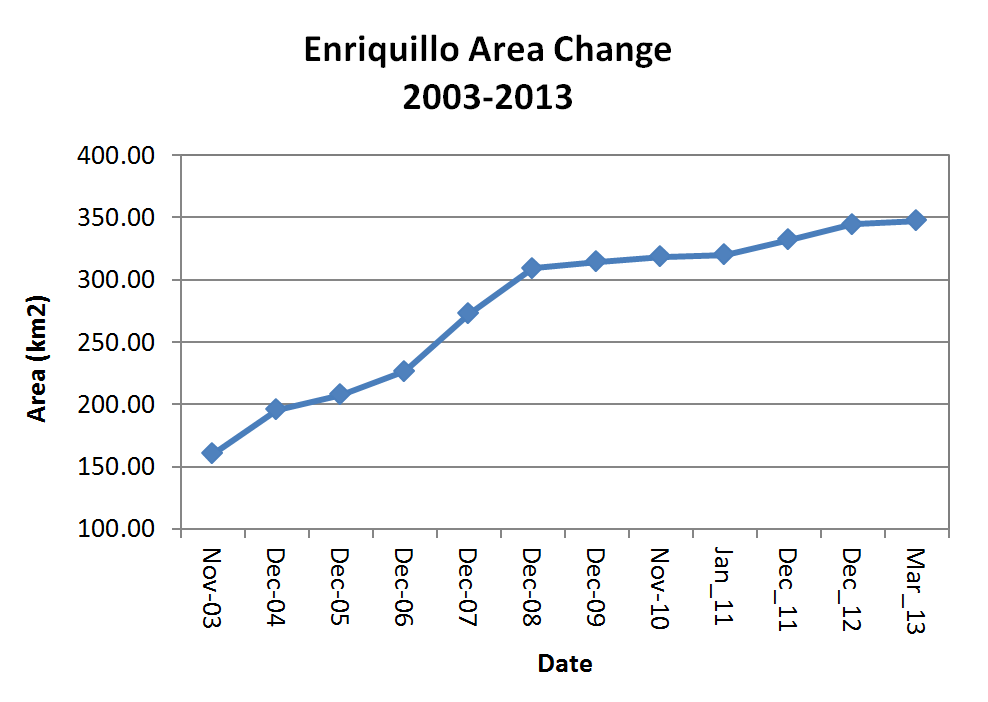
Surface Area and Volume
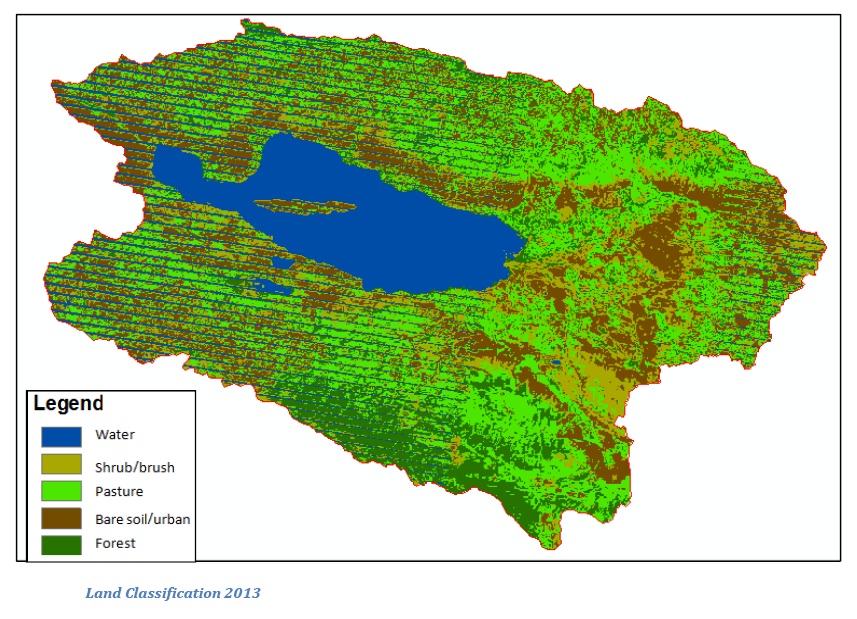
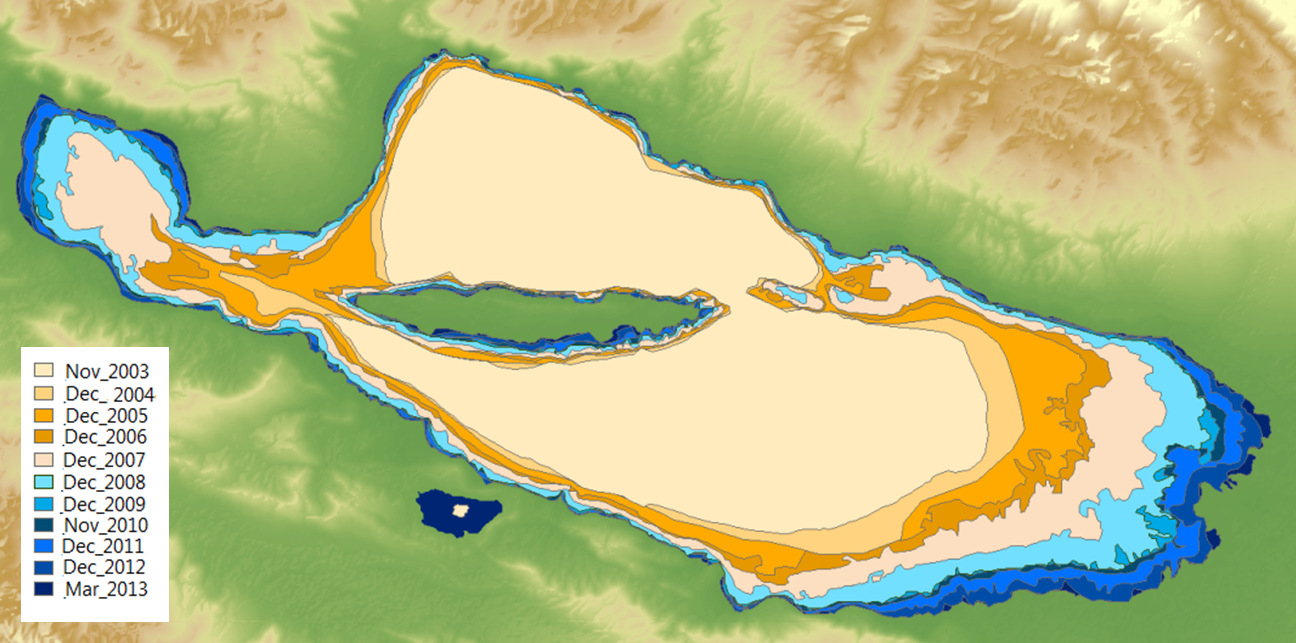
Lake Enriquillo is an endorheic lake with a large watershed. By analyzing the surface area of the lake over the past 30 years, we were able to identify the patterns of change over time. We used data from USGS Earth Explorer database, GPS, Landsat TM and ETM optical passive satellites and Arc GIS to plot to the area of the lake in 2010 and 2013. Then a comparison to historical data was made.

surface_area_volume


volume_2003_2013

change_2003_2013

Land Use and Runoff
Land Use and Run Off
The type of land that surrounds Lakes Enriquillo and Azuei varies. With an increase in farmland, roads and small urban areas there is an increase in run off due to a lack of ground water infiltration. Run off rates change based on what kind of land exists in the area surrounding the lakes. The different types of land usages are determined using Landsat Imagery. These images are deciphered using a Digital Elevation Model (DEM) and NASA’s Shuttle Radar Topography Mission (SRTM). The Landsat images are examined for land use classification by converting multiband into single band raster imagery with categorical classes relating to different land coverage. The land coverage is represented by training samples. The samples are collected by ground truthing. The Maximum Likelihood method is then used, which is a way of assigning pixels to different classes. The run off values are based on these classes.On the maps produced (2005 & 2013) it can be seen that not only Lake Enriquillo has increased in size but also the other water bodies in the south of the watershed. There is more bare soil/urban area and less forest in 2013 when compared to 2005.

Climate and Hydrological Modeling
Land Use and Run Off
The type of land that surrounds Lakes Enriquillo and Azuei varies. With an increase in farmland, roads and small urban areas there is an increase in run off due to a lack of ground water infiltration. Run off rates change based on what kind of land exists in the area surrounding the lakes. The different types of land usages are determined using Landsat Imagery. These images are deciphered using a Digital Elevation Model (DEM) and NASA’s Shuttle Radar Topography Mission (SRTM). The Landsat images are examined for land use classification by converting multiband into single band raster imagery with categorical classes relating to different land coverage. The land coverage is represented by training samples. The samples are collected by ground truthing. The Maximum Likelihood method is then used, which is a way of assigning pixels to different classes. The run off values are based on these classes.On the maps produced (2005 & 2013) it can be seen that not only Lake Enriquillo has increased in size but also the other water bodies in the south of the watershed. There is more bare soil/urban area and less forest in 2013 when compared to 2005.

Contact Us

We're not around right now. But you can send us an email and we'll get back to you, asap.

Not readable? Change text. captcha txt

Start typing and press Enter to search